Why most engineering metrics fail
The problem isn't that engineering metrics are useless. The problem is that we often ask them to answer questions they were never designed to answer.
Engineering leaders have never had more data, and have arguably never been more confused by it.
Modern delivery platforms will happily tell you deployment frequency, lead time, cycle time, pull request activity, change failure rate, mean time to recovery and a few dozen other numbers nobody asked for. Product adds another layer. Finance wants predictability, executives want visibility, and everyone wants a chart.
The result is an endless supply of dashboards and a permanent, low-level sense that none of them are answering the actual question.
And the actual questions are simple enough. Are our teams any good? Are we delivering anything worth delivering? Are we getting better?
The instinct is to fix this by collecting more metrics. In my experience it's almost always the opposite. Most organisations are drowning in data and starved of interpretation. The challenge was never the measuring; it's working out what the measurement is actually telling you, which is usually something other than what you wanted to know.
The problem isn't that engineering metrics are useless. The problem is that we keep asking them to answer questions they were never built to answer.
The difference between signals and outcomes
The most common mistake in engineering leadership is mistaking a signal for an outcome.
Metrics are signals. Customers experience outcomes. The two are not the same thing, and the gap between them is where a lot of well-meaning measurement goes to die.
A customer does not care about your deployment frequency. They care whether the feature exists and whether it works. They do not care about lead time; they care whether their problem got solved. And they have, I promise you, never once cared about a story point. This sounds blindingly obvious written down, and organisations lose sight of it constantly.
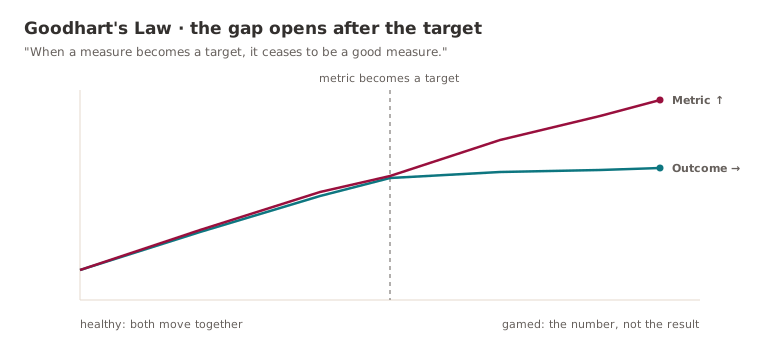
Metrics earn their keep by giving you visibility into the health of a delivery system: spotting bottlenecks, challenging assumptions, surfacing trends. What they cannot do is measure customer value directly. The danger starts the moment a signal gets promoted to being the goal itself, because from that point people optimise for the number instead of the thing the number was standing in for.
None of this is unique to software. Economists have been describing it for decades. Goodhart's Law puts it best:
When a measure becomes a target, it ceases to be a good measure.
Engineering organisations rediscover this roughly once a quarter, usually the hard way.
The story point illusion
Velocity is still one of the most-used metrics in software delivery, despite roughly a decade of people pointing out the problem.
To be fair, velocity isn't the villain here. Used properly, it's a perfectly reasonable planning signal: a team looks at how much it has historically got through and uses that to make sensible commitments about the future. Nothing wrong with that.
The wheels come off when velocity becomes a management objective. The moment leadership starts asking a team to "increase velocity", the metric changes character. Stories get broken down a bit differently. Estimates get a touch more generous. Work gets categorised in creative new ways. Velocity goes up. The dashboard looks lovely. The organisation feels productive.
And the customer experiences precisely the same product as before.
Velocity was never measuring productivity. It was measuring a team's internal estimation habits. Forget that distinction and you've inflated a number that now means nothing - the management equivalent of being chuffed with a healthy material count while your king's quietly getting mated in the corner. The same pattern turns up again and again across delivery metrics.
Why comparing teams is harder than it looks
Leadership will, sooner or later, ask for a single unified view of engineering performance. It's an understandable request (twenty teams, surely one consistent scoreboard?) and it's usually a trap.
Take three teams.
The first owns a payments platform. Reliability requirements are brutal; a botched deploy has immediate financial consequences. The second owns customer-facing mobile, where success means rapid experimentation and shipping often. The third owns platform infrastructure, whose entire job is reducing risk and making everyone else faster.
All three can be excellent. All three will produce wildly different numbers. The payments team deploys rarely because stability beats speed. The mobile team ships daily. The platform team spends three months on an upgrade that no customer will ever see and the business cannot live without.
Rank them on one metric and one of them comes out looking like the weak link. Judge them by what they're actually for, and that conclusion is simply wrong. The same number tells completely different stories depending on where it came from, and a single leaderboard strips all of that context away.
The promise and limitations of DORA
The arrival of DORA metrics was a genuine step up in how the industry thinks about delivery.
Unlike a lot of what came before, DORA looked at the delivery system rather than individual output. Deployment frequency, lead time, change failure rate and mean time to recovery are all useful indicators of engineering health. The key word, though, is indicators.
A team with pristine DORA metrics can still build entirely the wrong product. A team with mediocre ones can create enormous value. This doesn't make the metrics worthless. Quite the opposite - they're some of the most useful operational numbers a leader has. It just means they have to be read alongside business outcomes, not in splendid isolation. A healthy delivery system is a good thing. It is not the same thing as a successful product, and pretending otherwise is how you end up shipping the wrong thing very efficiently.
AI is creating a new generation of bad metrics
Right on cue, the industry is now making all the same mistakes again, this time with AI.
Leadership reasonably wants to know whether the AI tooling is paying for itself. Unfortunately most of the proposed measurements are, once again, counting activity instead of outcomes. How many prompts were submitted? How many lines of AI-generated code shipped? How many engineers used AI today?
Easy questions to answer. Not remotely useful ones.
An engineer churning out ten thousand lines of AI-assisted code may be creating less value than one using AI sparingly to accelerate investigation, explore an architecture, or write the tests they'd otherwise skip. The objective was never AI utilisation. The objective is better engineering outcomes. Story points became a poor proxy for productivity; AI activity is shaping up to be a poor proxy for effectiveness. New technology, same old measurement trap.
What good engineering metrics actually do
The best engineering organisations I've worked with treat metrics as the start of a conversation, not the end of one.
Metrics are brilliant at flagging anomalies. They expose bottlenecks, surface reliability concerns, show where work is getting stuck, reveal trends you'd never have spotted by eye. What they cannot do is tell you why. And the why is the entire game.
A spike in lead time might mean a broken process. It might also mean a team is halfway through a large architectural migration. A jump in incidents might mean falling quality. It might also mean a team has finally started surfacing problems that were always there. The metric points you at the question. Working out the answer still takes judgement, and no dashboard has ever supplied that.
Measuring systems, not people
The most important lesson is that software delivery is a systems problem.
Outcomes emerge from the interaction of people, process, tooling, architecture, org structure and business priorities all at once. Try to collapse that into individual performance metrics and you'll get a poor result and a demoralised team to go with it.
Strong organisations work on the system instead. They invest in tooling. They strip out friction. They improve deployment. They strengthen observability. They simplify architecture. They build an environment where good people can do good work. The aim is not to make individuals grind harder; it's to make the system work better. The best metrics simply tell you whether that's happening.
Better questions
Engineering leaders love to ask: "Which metrics should we track?"
A far better question is: "What decision will this metric actually help us make?"
If there's no clear answer, the metric is probably decoration. Metrics should exist to support decisions, challenge assumptions and improve understanding, not because the platform happened to make them available.
The organisations that use metrics well understand this. They collect aggressively, interpret carefully, and stay sceptical of any conclusion that arrives too neatly. Most of all, they remember that the goal was never to improve the dashboard. The goal was always to improve the engineering system sitting behind it.
Further reading
- DORA research program: the canonical home of the four key metrics and the wider work on what actually predicts delivery performance.
- The SPACE of Developer Productivity: Forsgren and co. on why productivity is multi-dimensional and never reducible to a single number.
- Measuring developer productivity? A response to McKinsey: Gergely Orosz and Kent Beck on why measuring effort and output instead of outcomes tends to backfire.
Keep reading
New writing, now and then
Occasional notes on platform engineering, building dependable software and that constant buzz word we doom scroll past on LinkedIn! No cadence promised.