# Designing for sub-100ms: latency budgets in trading UIs
> When a price moves, the screen has one job: show it before the trader notices the delay. A practical look at spending a latency budget across transport, processing, rendering and paint.
By Matthew D. Webb · 2022-01-01 · 6 min read
Canonical: https://mdwebb.io/articles/latency-budgets-trading-uis/
AI involvement: Updated with images, a diagram and the interactive demo.
---
Most web applications are built around interactions measured in seconds. Trading systems play an entirely different game.
I spent years building interfaces running on a trading floor, and you learn one lesson very quickly: the gap between an event arriving and a pixel changing isn't a nice-to-have. It's the difference between a screen a trader trusts and one they work around, and a screen that gets worked around might as well not exist.
When the market moves, the interface is worth exactly as much as its ability to reflect that move *now*. A trader won't consciously clock a delay much under 100ms, but they will absolutely notice when a screen feels stale, or when it disagrees with the other source of truth two monitors over.
And on a desk, the cost of acting on a stale price is measured in real money. Sometimes a frightening amount of it.
The thing that keeps these systems honest is the **latency budget** - a fixed allocation of time from event arrival to pixel rendered. Instead of treating performance as a vague aspiration to get to "later", the budget turns it into a constraint that every engineering decision has to answer to.
## Start with an end-to-end budget
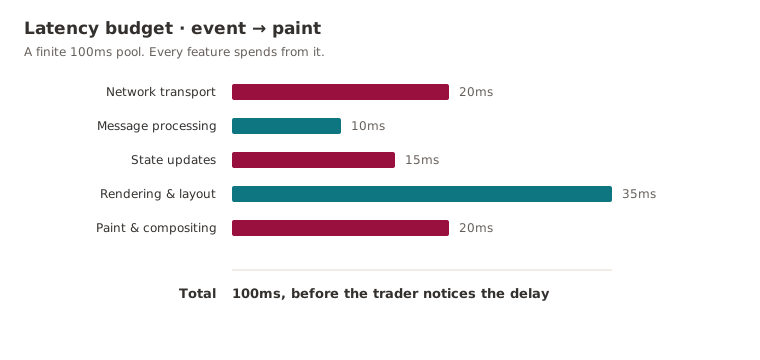
For a browser-based trading screen, a sane starting target might be:
| Stage | Budget |
|---------|---------|
| Network transport | 20ms |
| Message processing | 10ms |
| State updates | 15ms |
| Rendering & layout | 35ms |
| Paint & compositing | 20ms |
| **Total** | **100ms** |
The exact figures matter far less than the principle. Once the budget exists, every feature is spending from a finite pot. Extra processing, another round of state reconciliation, an expensive layout pass, a needless re-render: each one has a price, and you can see who's paying it. Performance stops being an optimisation exercise you'll get to eventually and becomes a design constraint you live inside from day one. Like a clock in a blitz game, the budget doesn't care how clever your move is if you've run out of time to make it.
## The cheapest update is the one you never render
Market data arrives far faster than any human can take it in.
A liquid instrument can throw off dozens or hundreds of updates a second; a typical display refreshes 60 times a second, and even a 120Hz monitor can't show you every individual tick. Trying to render all of them just manufactures work the user will never lay eyes on.
So the better trading interfaces treat rendering as a *sampled* view of a continuous stream:
```ts
let pending = new Map();
let scheduled = false;
function onTick(tick: Tick) {
pending.set(tick.symbol, tick); // last write wins
if (scheduled) return;
scheduled = true;
requestAnimationFrame(flush);
}
function flush() {
applyTicks(pending);
pending.clear();
scheduled = false;
}
```
That collapses an unbounded firehose into at most one UI update per frame. More to the point, it works *with* [the browser's rendering cycle](/articles/the-event-loop-is-not-what-you-think/) instead of constantly elbowing against it.
The difference is easier to feel than to describe. Below, one simulated market stream feeds two pipelines: a naive one that renders every tick through a growing queue, and a budgeted one that coalesces to a single paint per frame. Push the tape towards a fast market and watch where each one ends up.
## Measure event-to-paint, not function timings
The easiest trap in performance work is falling in love with individual function timings.
Your reducer runs in 2ms. A React component renders in 4ms. Lovely numbers, and neither of them tells you whether the user actually saw a fast update. The metric that matters is **event-to-paint latency**:
1. Market event received.
2. Application processes the update.
3. State changes propagate.
4. Browser renders.
5. Browser paints the result.
Only at step five has anyone actually *seen* the change. The teams running serious trading systems instrument that whole path rather than leaning on the odd local profiling session, because production telemetry has a habit of surfacing bottlenecks that never once showed their face on a developer's laptop.
## DOM updates are rarely the real bottleneck
A lot of [performance debate fixates on framework choice](/articles/most-js-performance-problems-arent-js/). In practice, once you've done the basics, React, Vue, Angular and the rest are rarely the main source of latency. The usual culprits are far more boring:
- Large table reflows.
- Expensive layout recalculations.
- Frequent style invalidation.
- Rendering thousands of visible rows.
- Object churn triggering garbage collection pauses.
A well-built React app will comfortably outpace a badly built vanilla one. The framework wars are mostly a distraction from the actual job - reducing how much rendering needs to happen at all.
## Backpressure matters
The most dangerous problem isn't a slow update. It's a system that falls behind.
If data arrives faster than the browser can chew through it, queues start to grow, latency climbs without limit, and before long the screen is showing information that's technically correct and completely useless. Good trading UIs apply backpressure without apology:
- Coalesce updates.
- Drop superseded values.
- Prioritise the instruments actually on screen.
- Virtualise large datasets.
- Never let a queue grow unbounded.
Freshness beats completeness almost every time. A trader would far rather see the latest price than a faithful replay of every intermediate price that flickered past in the last second.
## Performance is a product feature
The teams that consistently land sub-100ms updates are rarely doing anything exotic. They just treat latency as a first-class requirement and refuse to negotiate it away.
Every millisecond has an owner. Every feature has a cost. Every update competes for the same finite budget. That's all a latency budget really is: the thing that turns "make it fast" (which means nothing) into a constraint engineers can actually reason about, and one that shapes the architecture from the first design doc rather than getting bolted on in a panic during the final sprint.
## Further reading
- [The RAIL performance model](https://web.dev/articles/rail): the source of the 100ms response budget, and a sane way to think about where a user's tolerance actually runs out.
- [Rendering performance](https://web.dev/articles/rendering-performance): walks the full pixel pipeline (JavaScript, style, layout, paint, composite) and explains why you really only get about 10ms of useful work per frame.
- [Interaction to Next Paint (INP)](https://web.dev/articles/inp): the modern responsiveness metric, useful because it measures the whole path to a painted frame rather than some flattering function timing.
- [Streams API concepts: backpressure](https://developer.mozilla.org/en-US/docs/Web/API/Streams_API/Concepts): a clear explanation of high water marks and slowing the source down before a queue gets out of hand.